| Current | 48 Hour | Trend over the last 48 hours | ||||||||||||||||||||||||||||||||||||||||||||||||||||||||||||||||||||||||||||||||||||||||||||||||||||||||||||||||||||||||||||||||||||||||||||||||||||||||||||||||||||||||||||||||||||||||||||||||||||||||||||||||||||||||||||||||||||||||||||||||||||||||
| Temperature |
54 °F
12 °C (Mid-mountain: 56 °F) (Base Area: 64 °F) |
Maximum 75 Minimum 51 |
|
|||||||||||||||||||||||||||||||||||||||||||||||||||||||||||||||||||||||||||||||||||||||||||||||||||||||||||||||||||||||||||||||||||||||||||||||||||||||||||||||||||||||||||||||||||||||||||||||||||||||||||||||||||||||||||||||||||||||||||||||||||||||
| Wind | WNW @ 14 MPH
23 km/h |
14 |
|
|||||||||||||||||||||||||||||||||||||||||||||||||||||||||||||||||||||||||||||||||||||||||||||||||||||||||||||||||||||||||||||||||||||||||||||||||||||||||||||||||||||||||||||||||||||||||||||||||||||||||||||||||||||||||||||||||||||||||||||||||||||||
| Snow depth | -0.5"
-1 cm (2 minutes ago) Snowfall since Oct 1st 158.5" # In-range / Out-of-range 1370 / 1562 |
|
|
|||||||||||||||||||||||||||||||||||||||||||||||||||||||||||||||||||||||||||||||||||||||||||||||||||||||||||||||||||||||||||||||||||||||||||||||||||||||||||||||||||||||||||||||||||||||||||||||||||||||||||||||||||||||||||||||||||||||||||||||||||||||
| Humidity | 83 % |
Maximum
100 Minimum 14 |
|
|||||||||||||||||||||||||||||||||||||||||||||||||||||||||||||||||||||||||||||||||||||||||||||||||||||||||||||||||||||||||||||||||||||||||||||||||||||||||||||||||||||||||||||||||||||||||||||||||||||||||||||||||||||||||||||||||||||||||||||||||||||||
| Barometer | 30.26" Hg
102.5 kPa |
Maximum 30.39" Minimum 30.19" |
|
|||||||||||||||||||||||||||||||||||||||||||||||||||||||||||||||||||||||||||||||||||||||||||||||||||||||||||||||||||||||||||||||||||||||||||||||||||||||||||||||||||||||||||||||||||||||||||||||||||||||||||||||||||||||||||||||||||||||||||||||||||||||
| Light Level |
Twilight
Sunrise Sunset Twilight Moon phase |
05:13
05:47 20:43 21:17 + 78 % |
|
|||||||||||||||||||||||||||||||||||||||||||||||||||||||||||||||||||||||||||||||||||||||||||||||||||||||||||||||||||||||||||||||||||||||||||||||||||||||||||||||||||||||||||||||||||||||||||||||||||||||||||||||||||||||||||||||||||||||||||||||||||||||
| Power rail | 13.00 Volts | V_panel = 3.22 V / V_batt = 25.98 V / I_1 = -0.29 A / I_2 = 0.00 A |
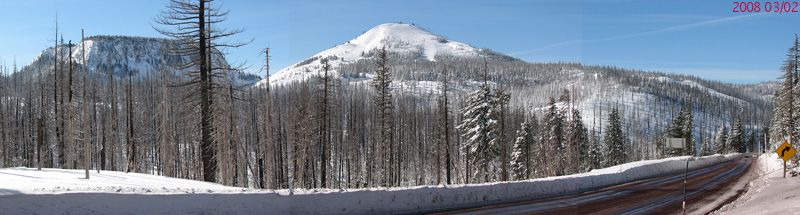
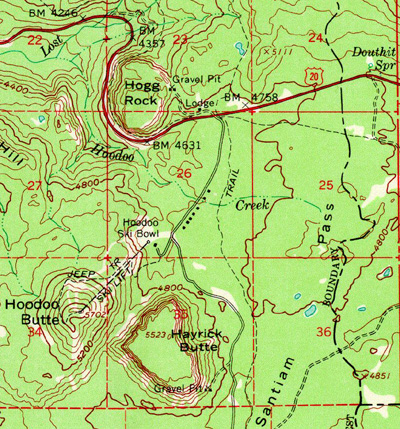
Hoodoo Butte is a 5700' (1737 m) volcanic cinder cone located on the crest of the Cascade Range in central Oregon.
On your map, it's about 2.5 miles southwest of Santiam Pass (Highway US 20, milepost 81), and about 1.5 miles west of the Pacific Crest Trail. For the GPS-inclined, that's about 44.402 N, 121.882 W (WGS84 datum).
Weather & related information:
| This is: | http://www.santiampsp.org/wx/weather.htm |
| Related Web Pages: |
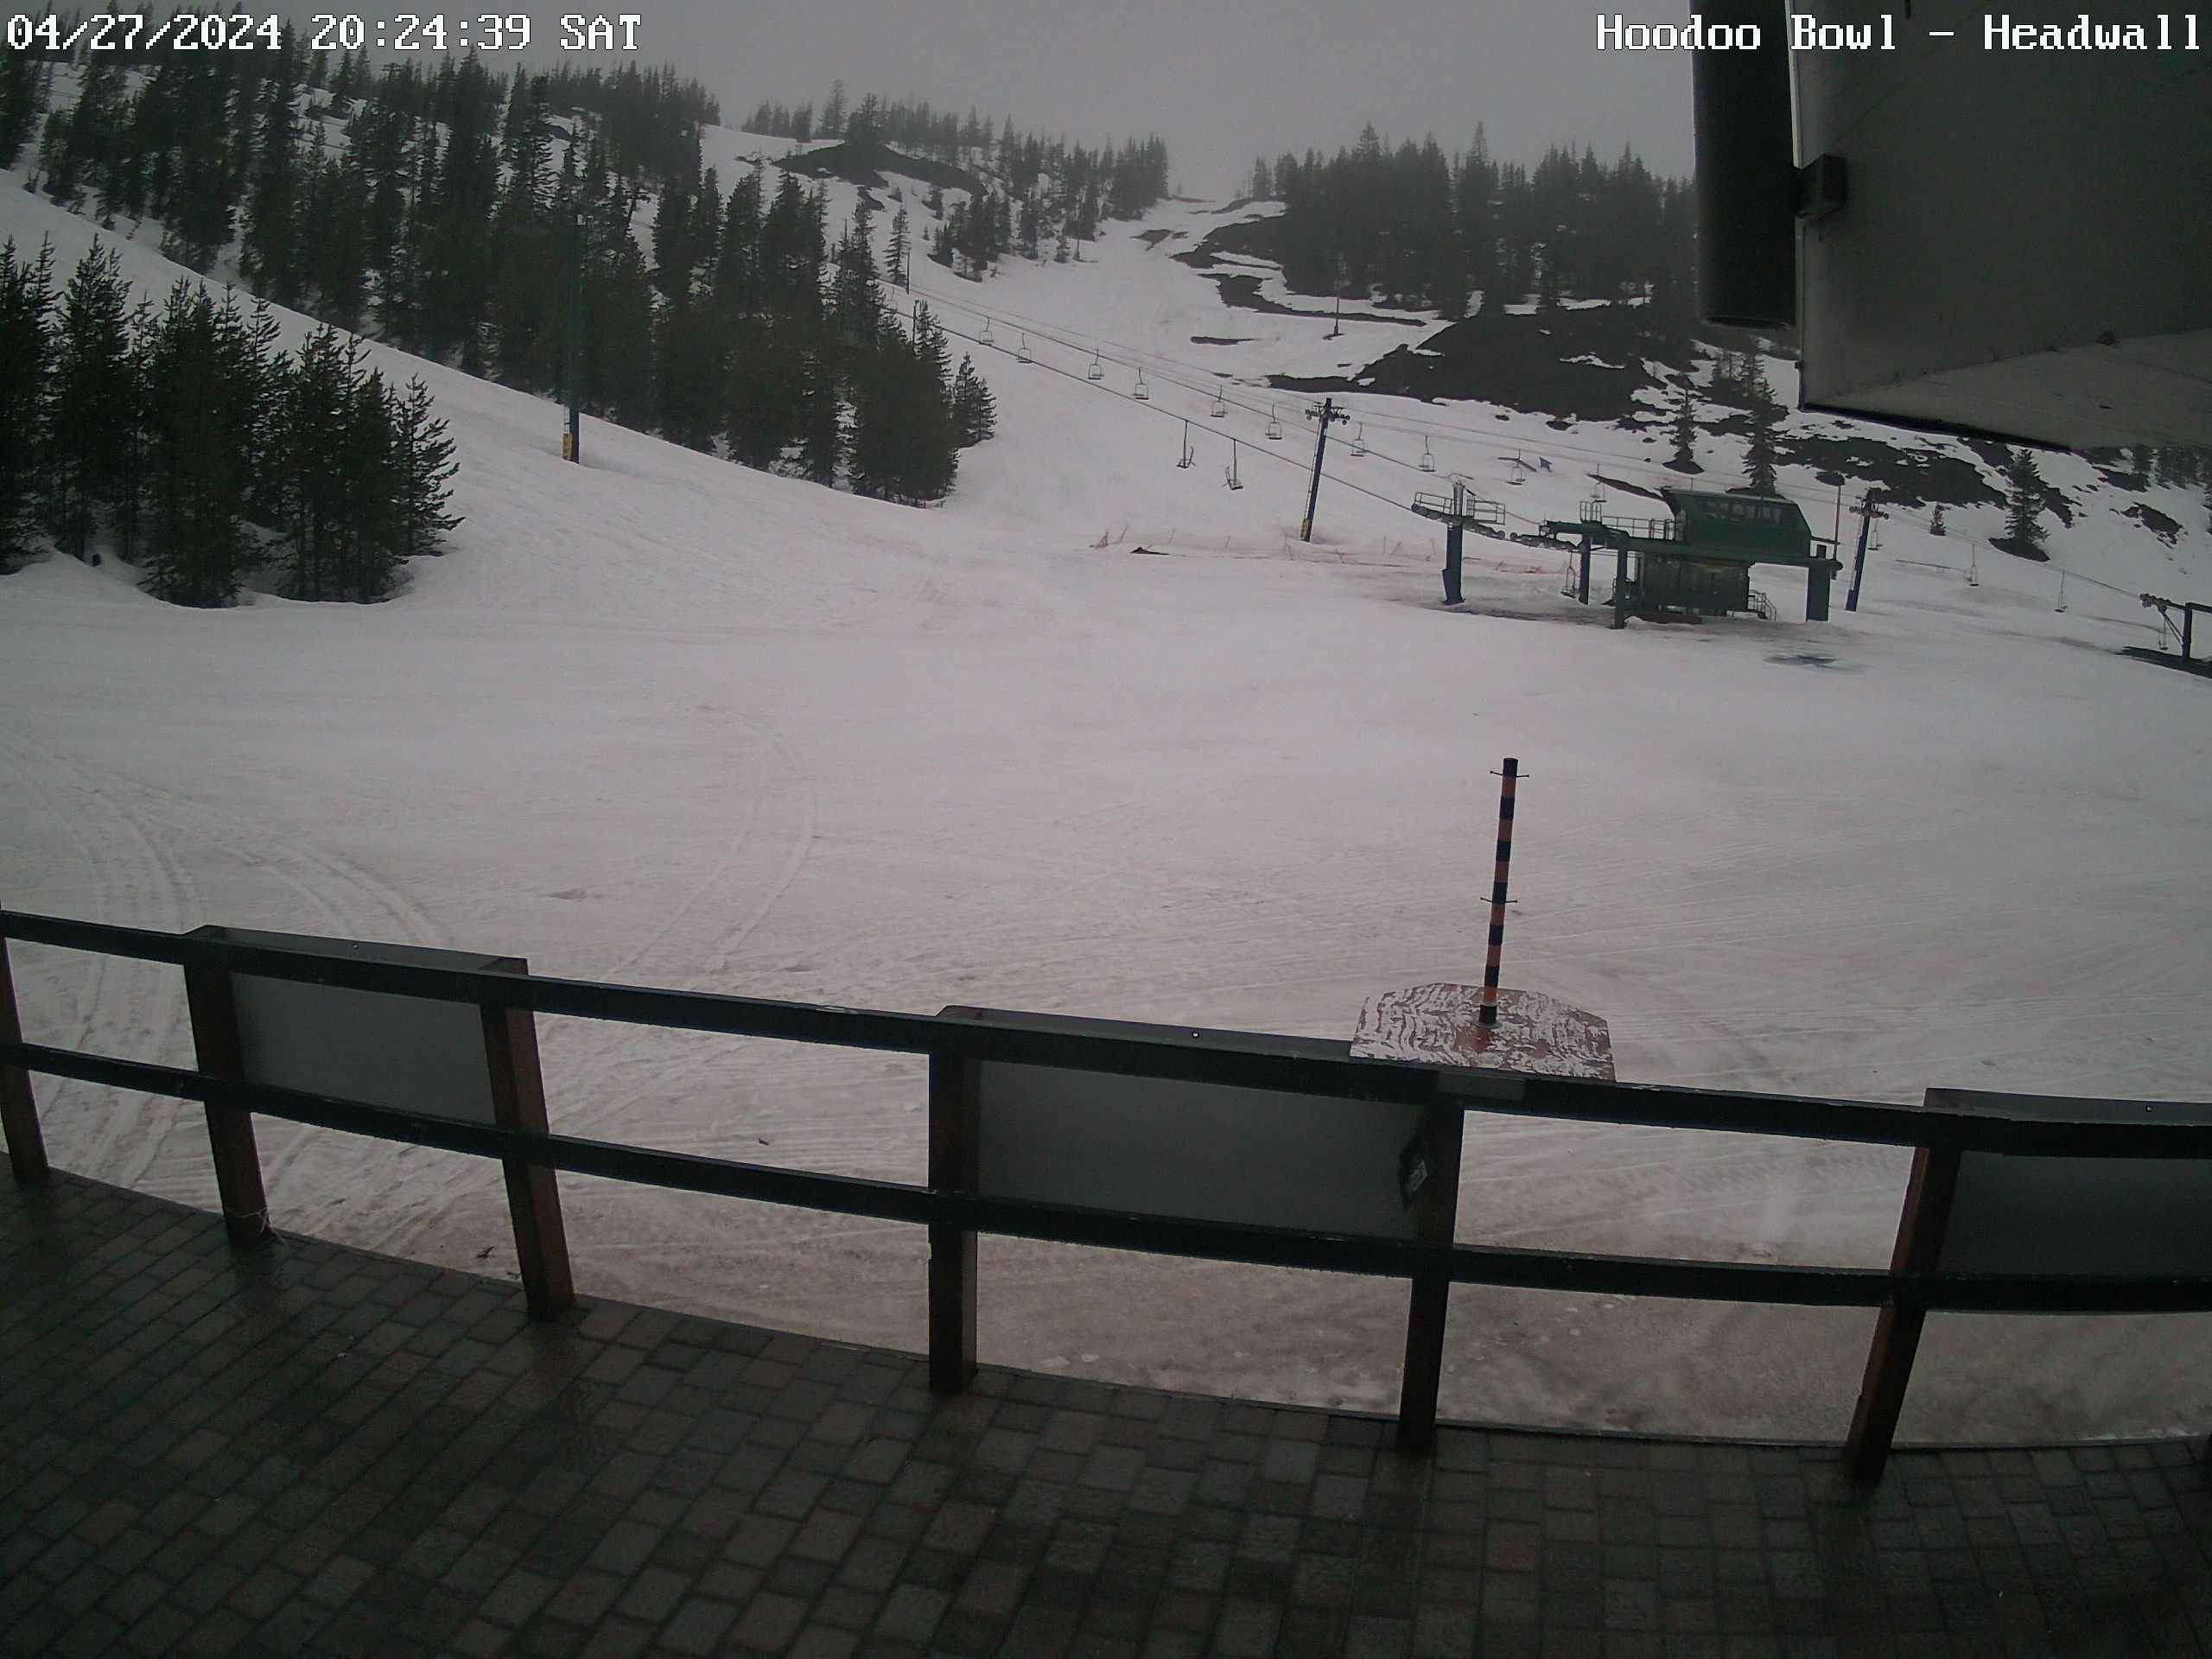
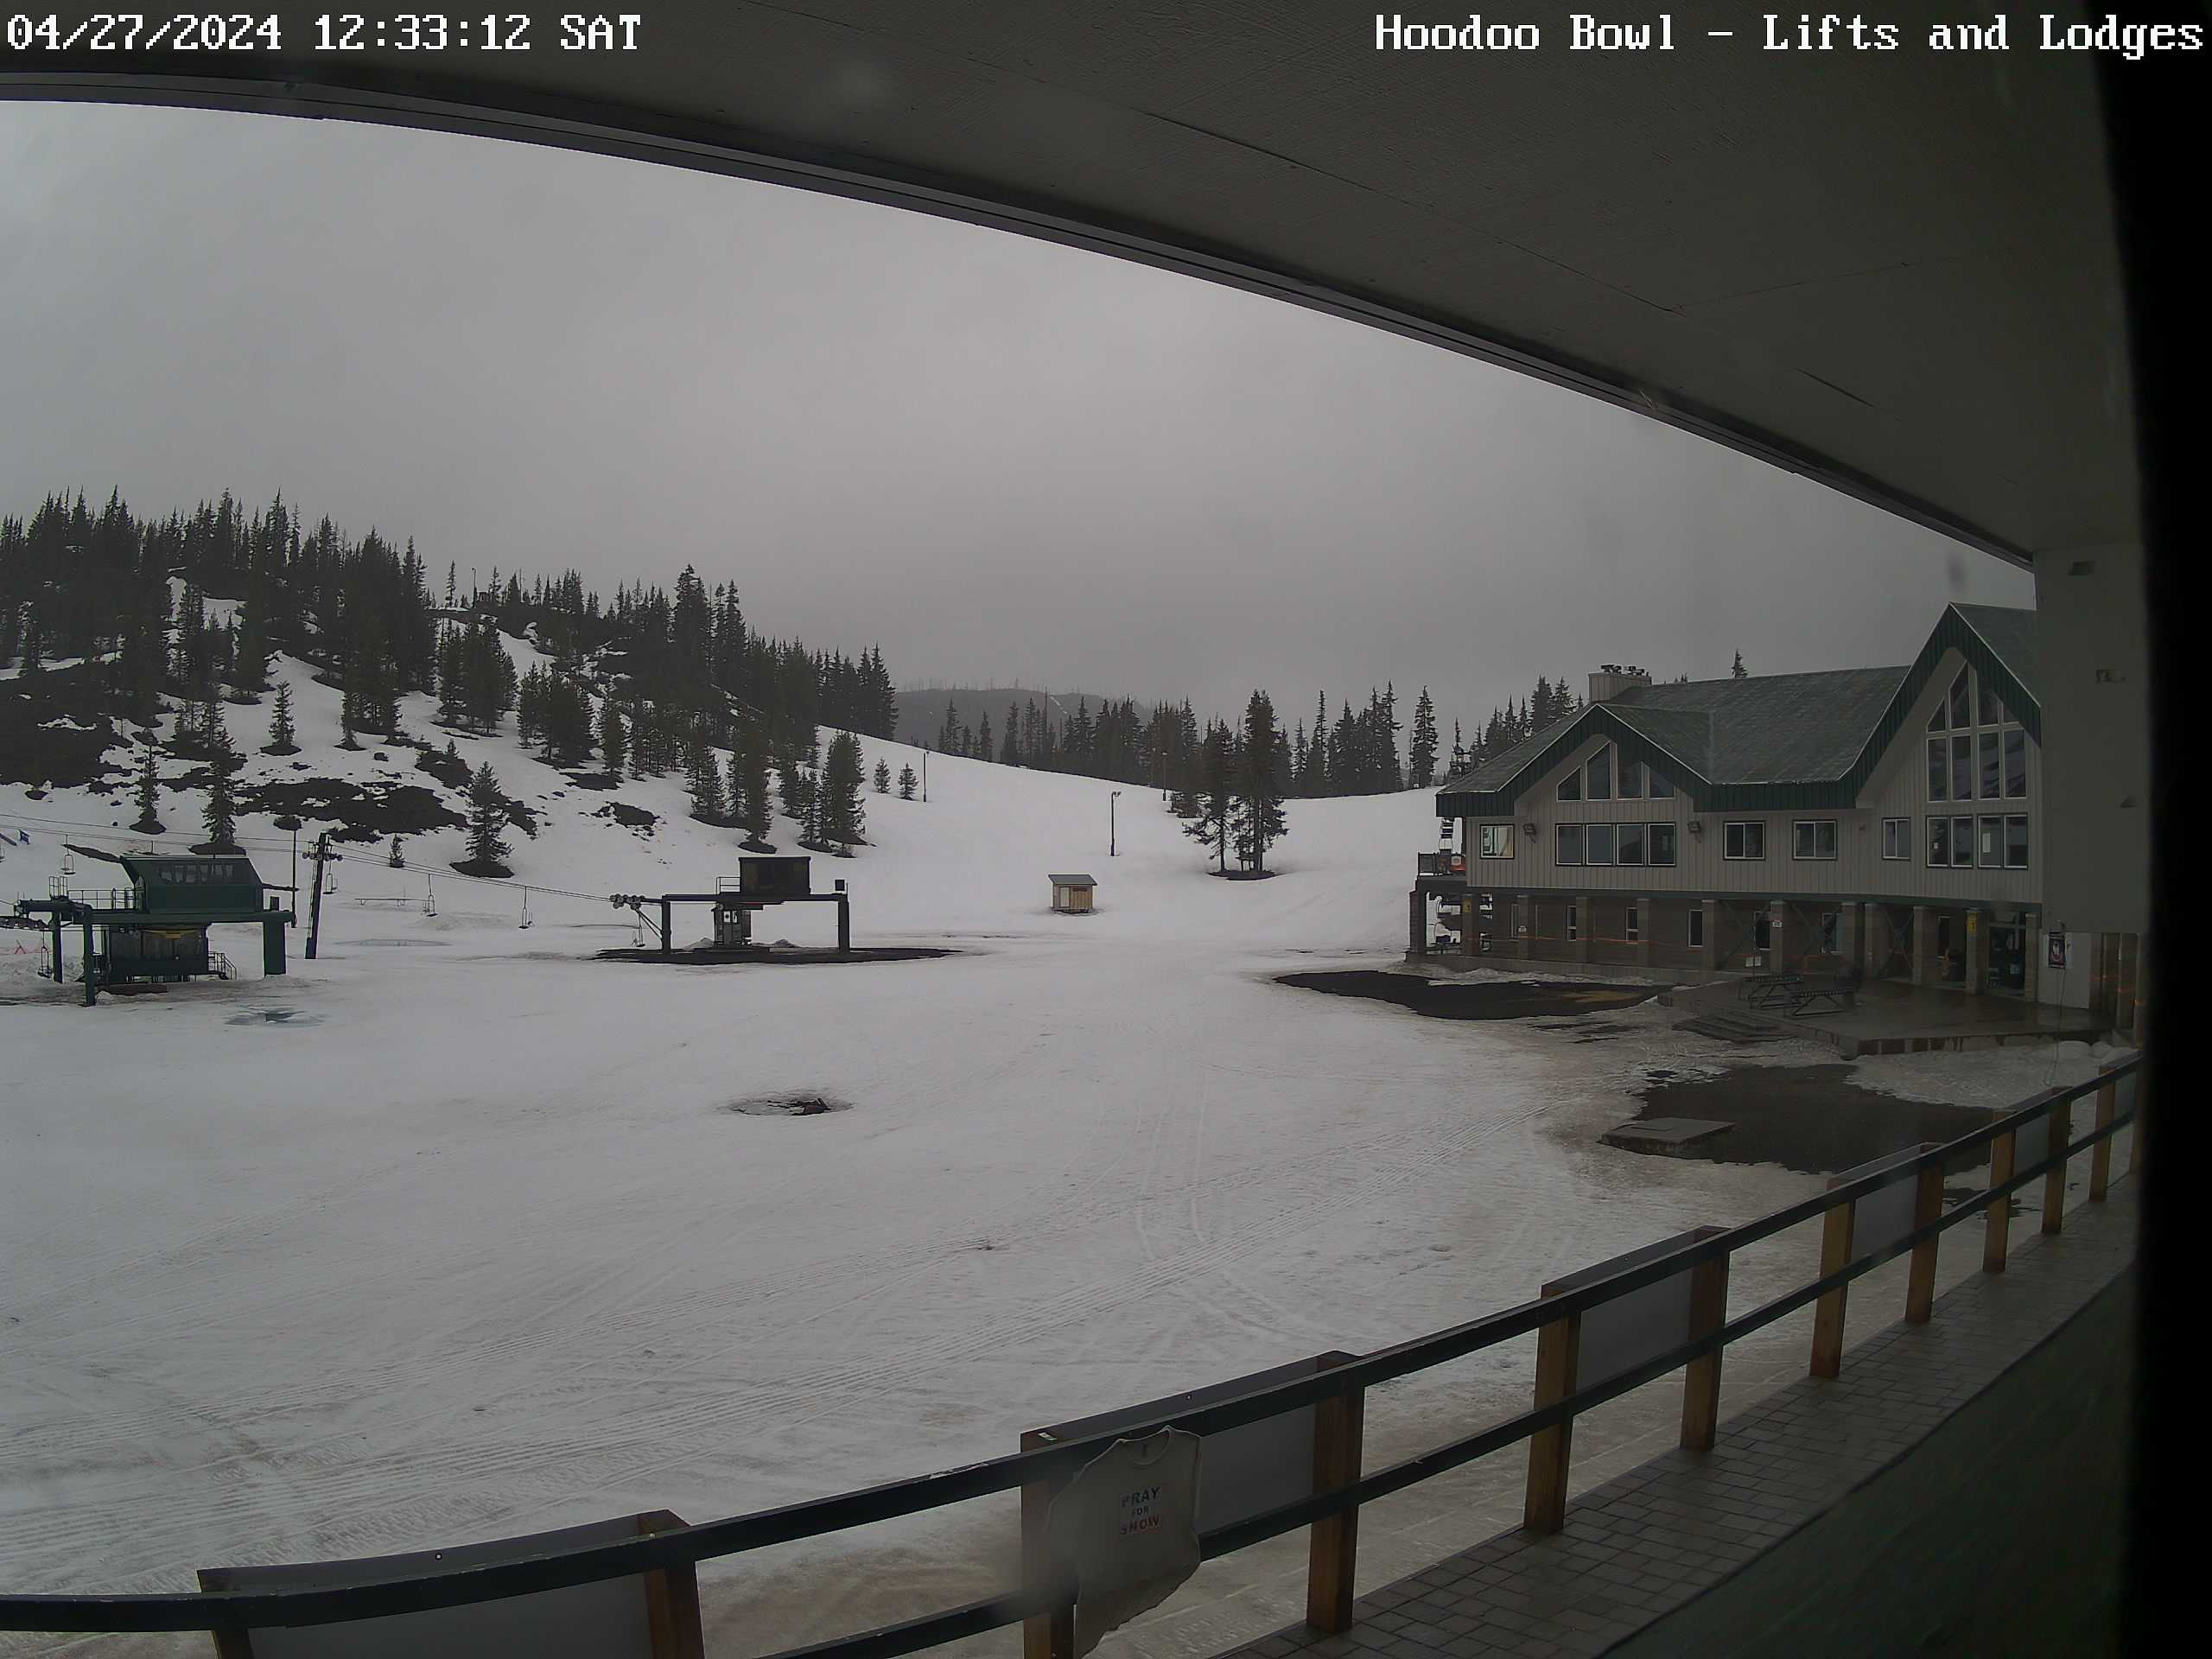
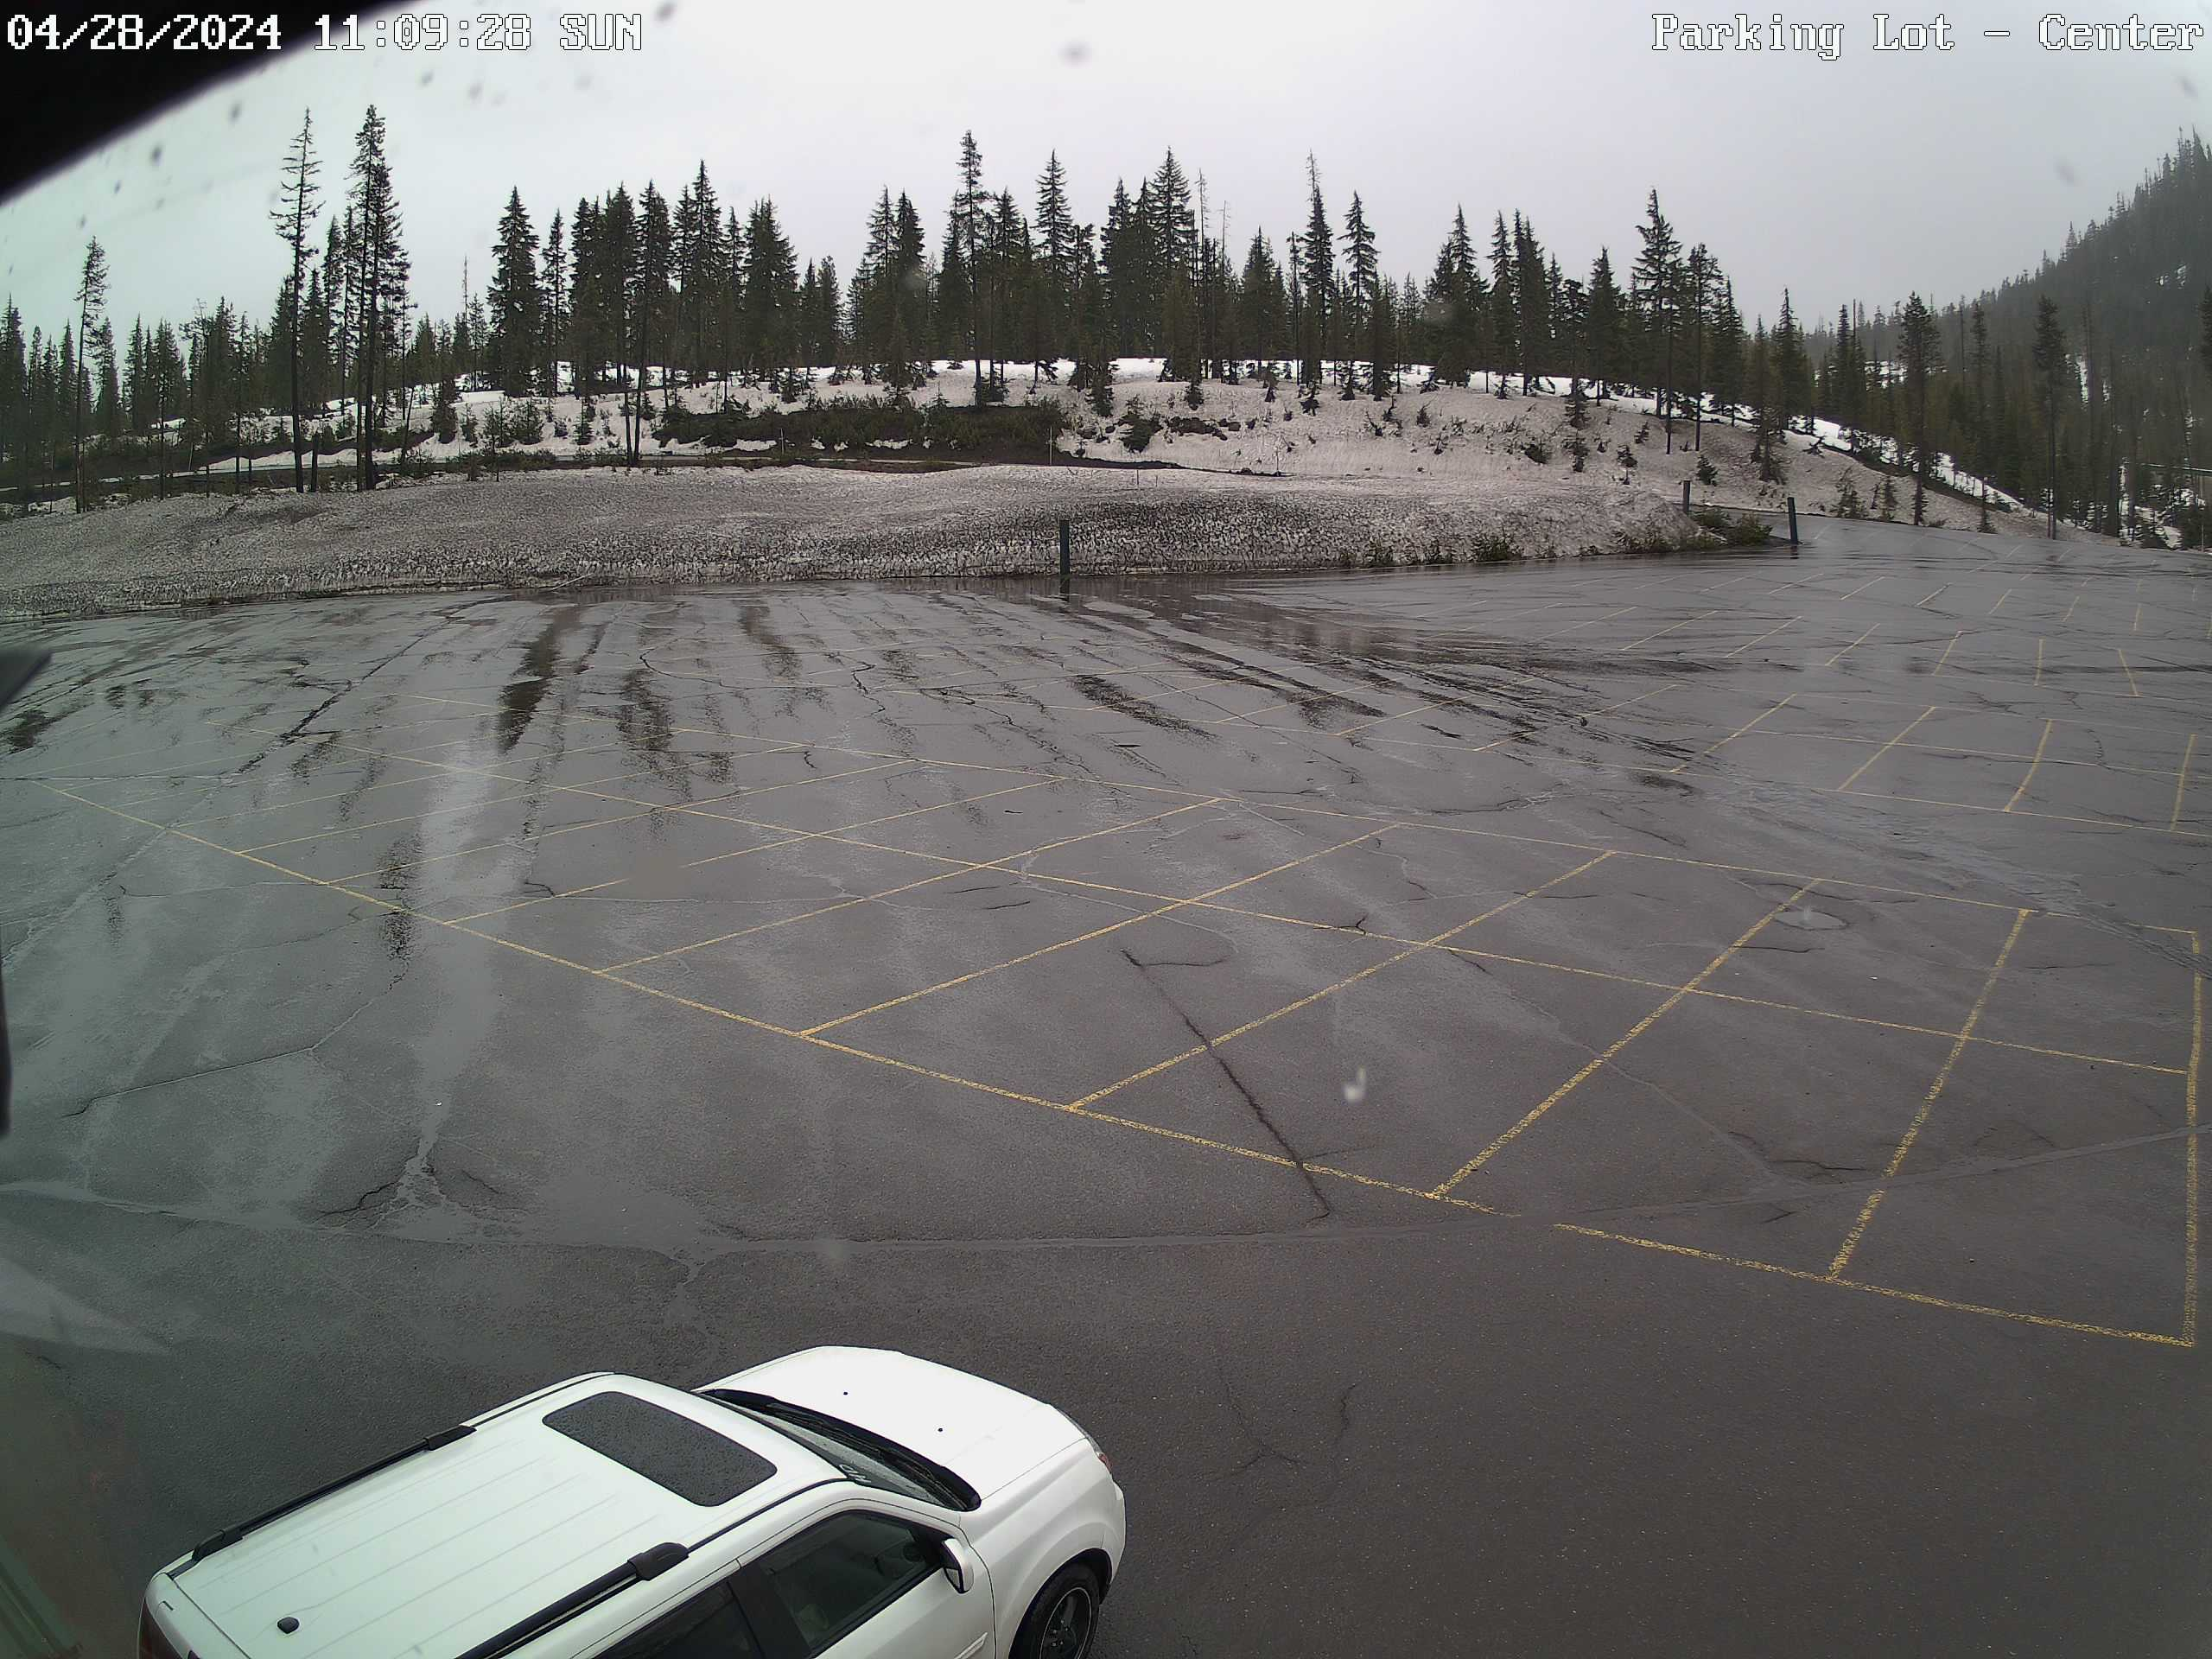
Multi-picture page (~670 Kbytes) w/
Top
Hodag,
NW view,
'Ed,
Manzanita,
Easy Rider,
Headwall,
Bowl,
Parking Lot
(center &
south)
and more (~20-70 Kbytes each)
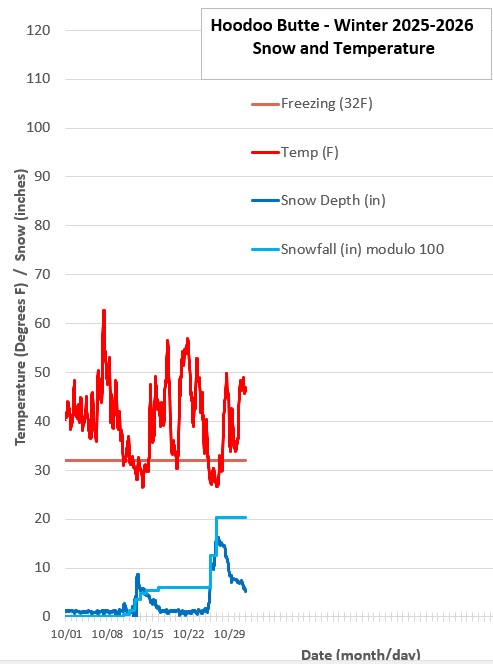
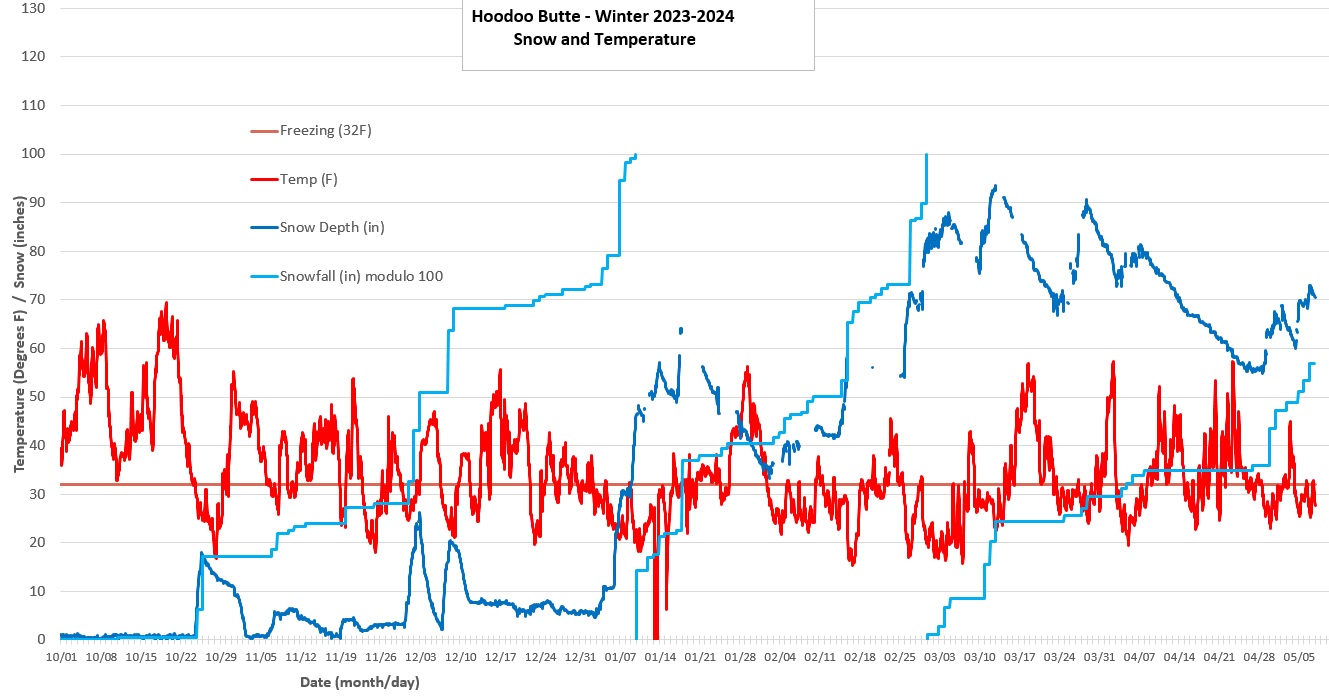
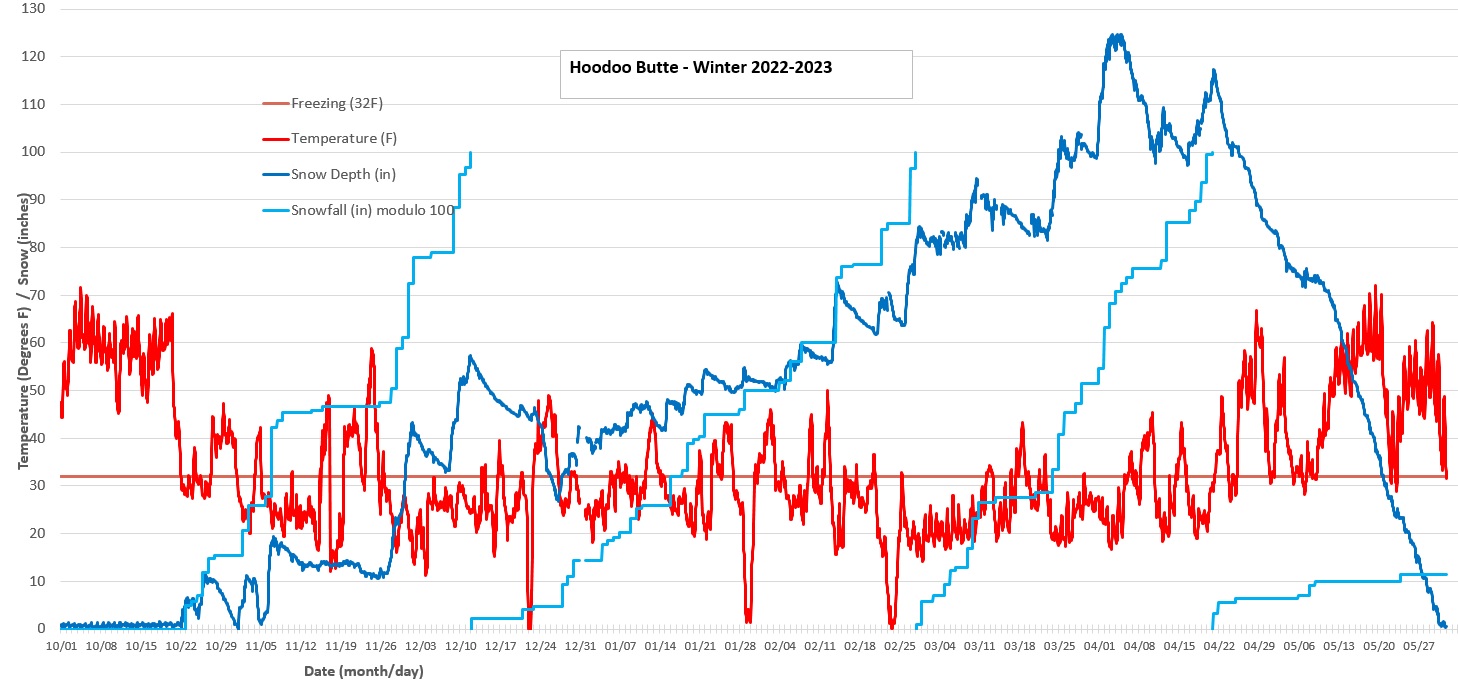
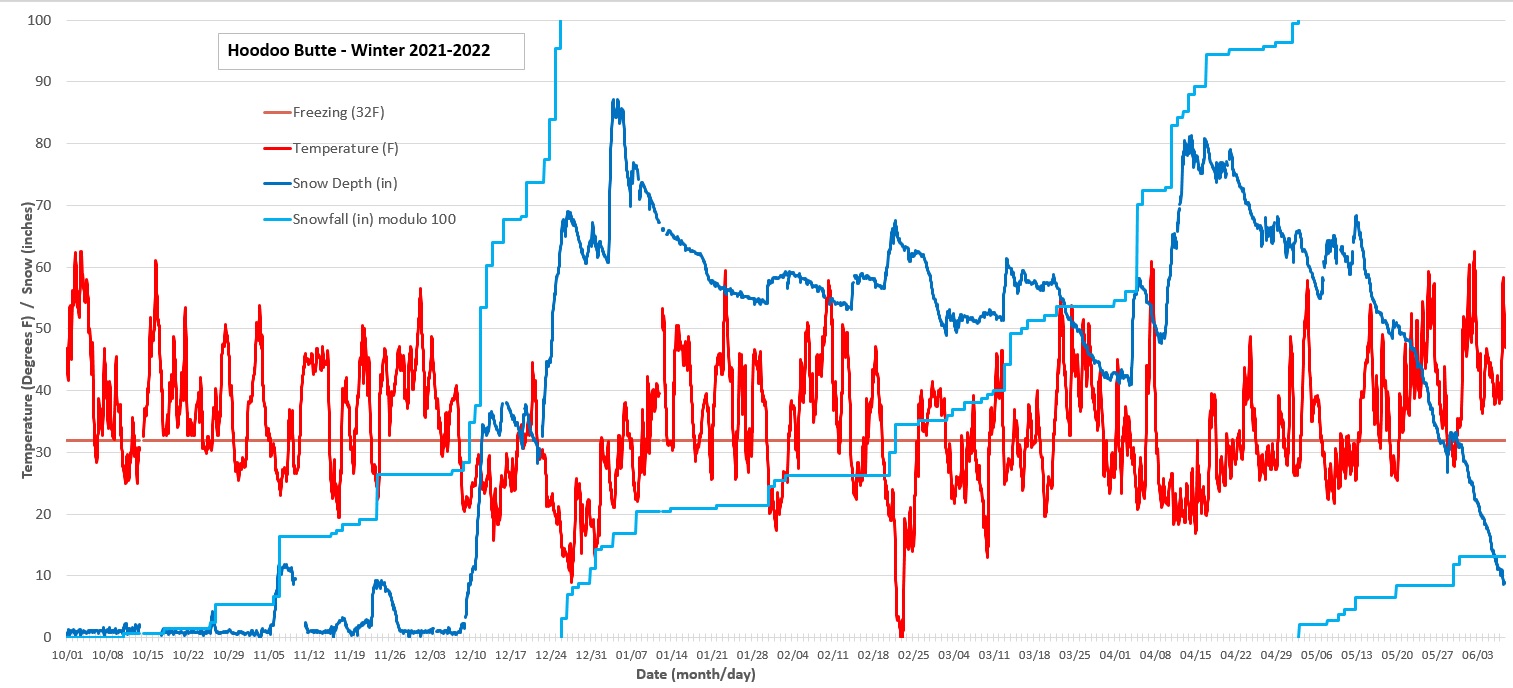
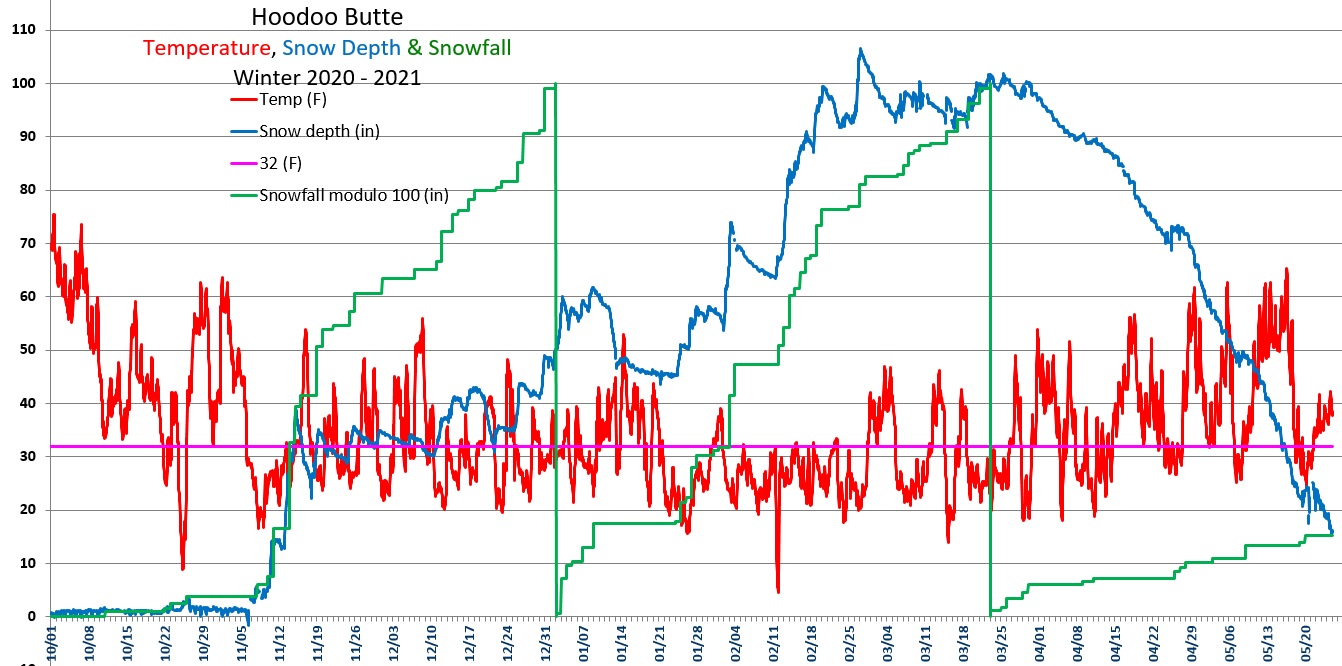
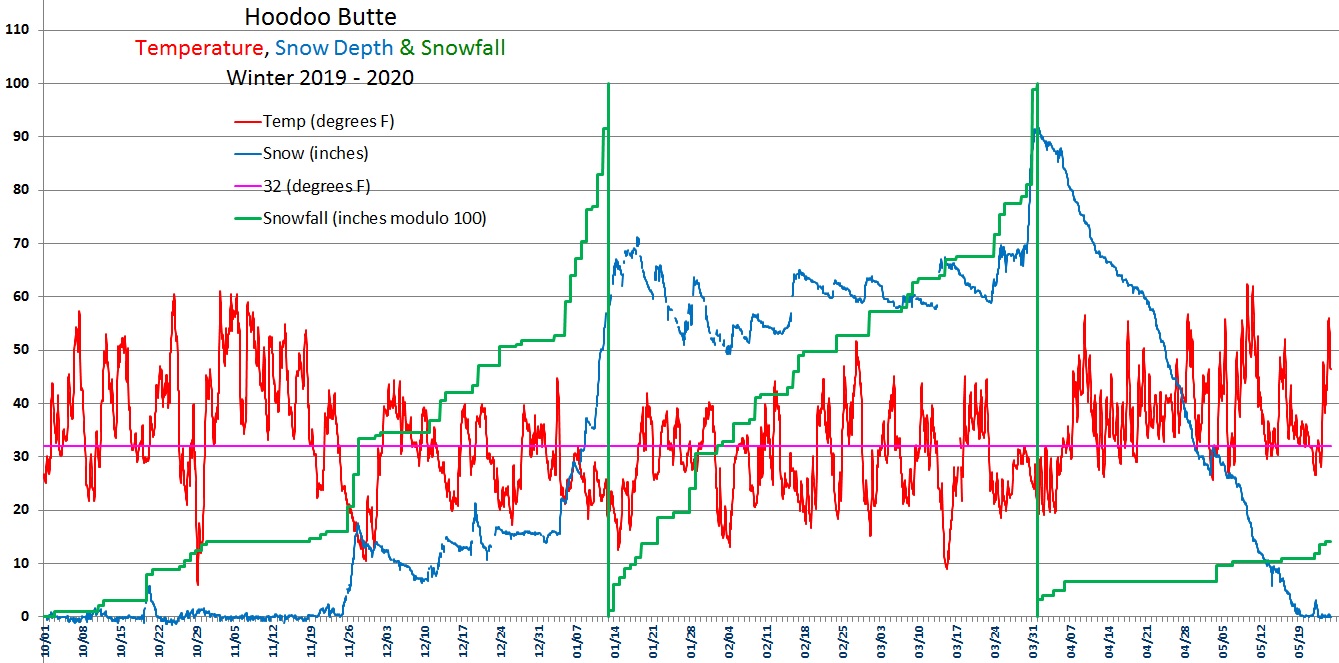
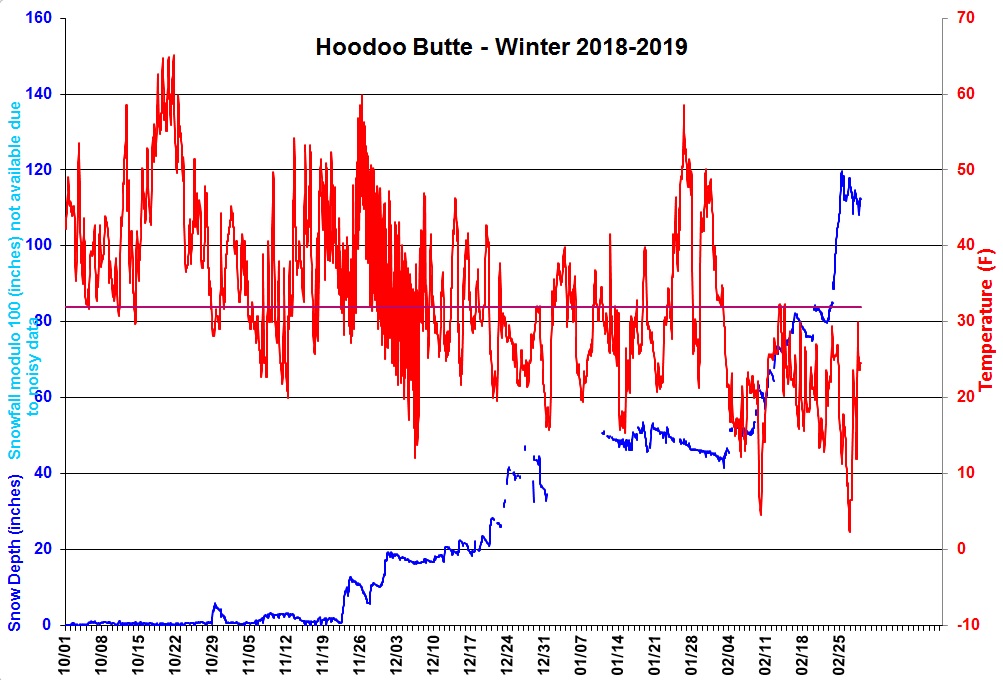
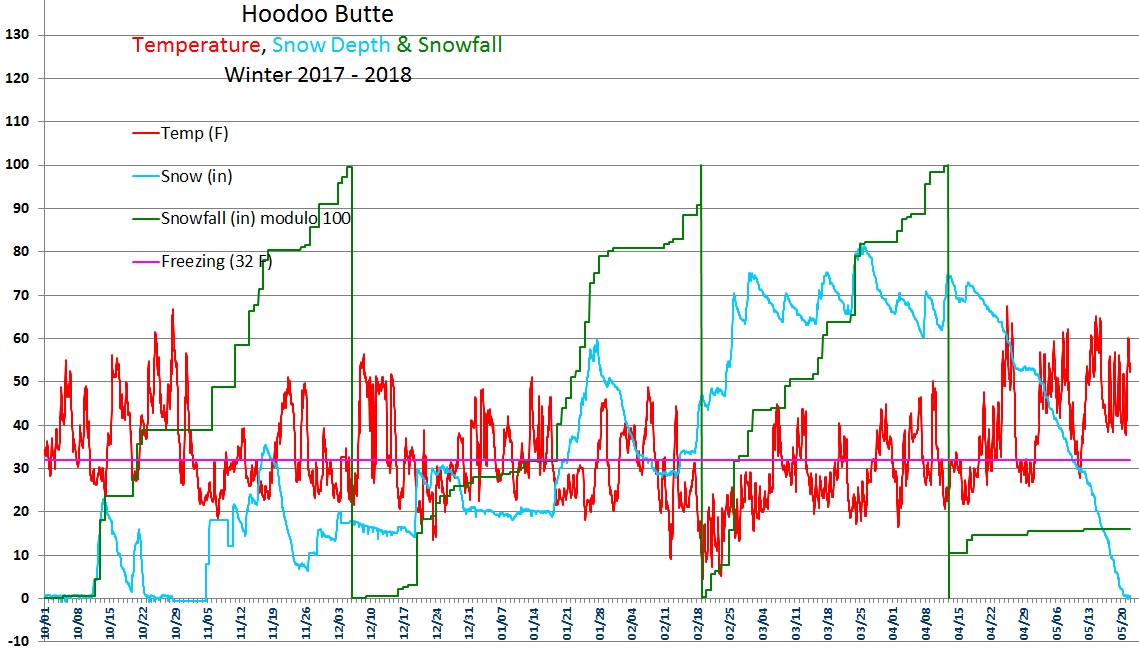
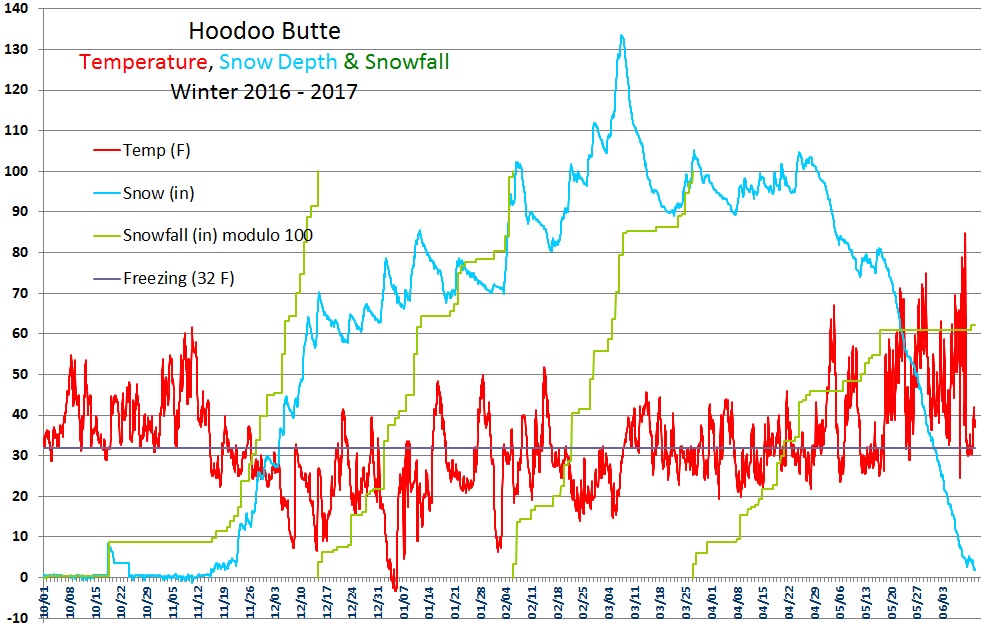
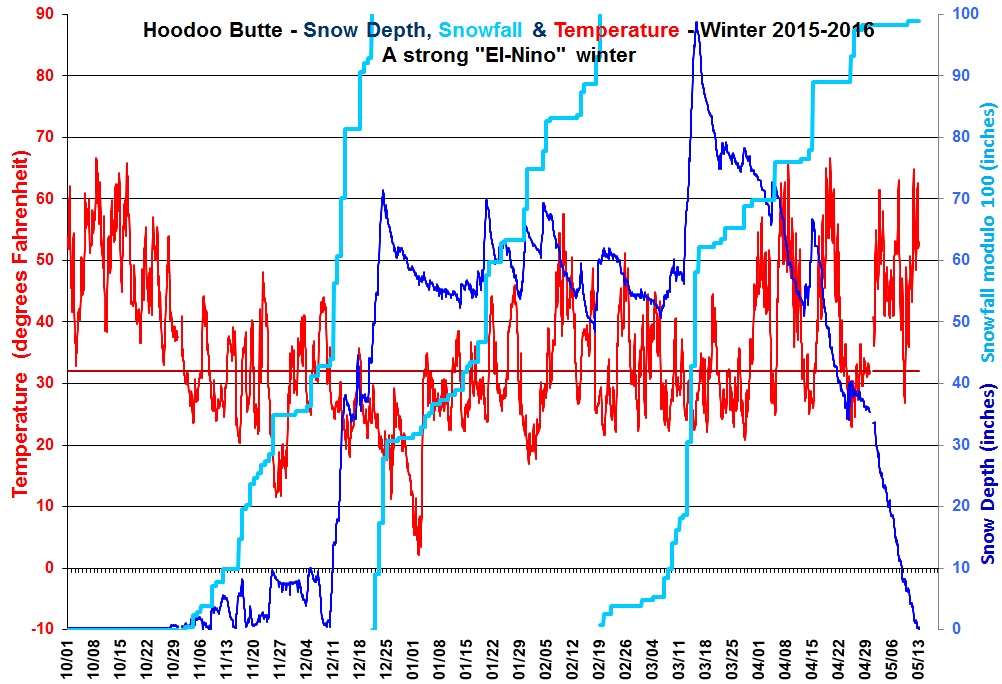
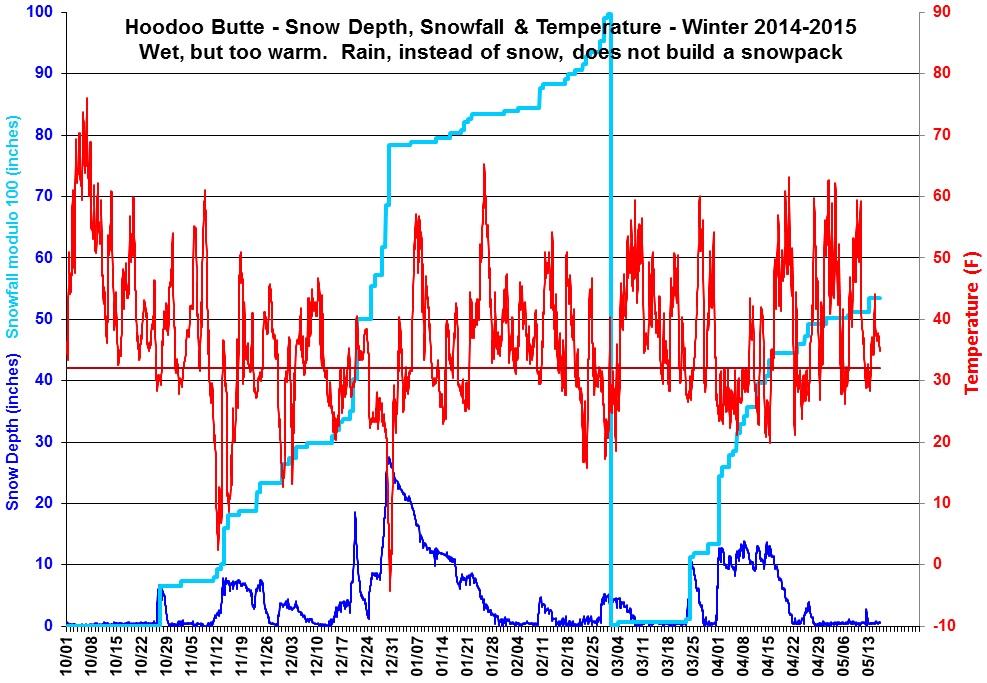
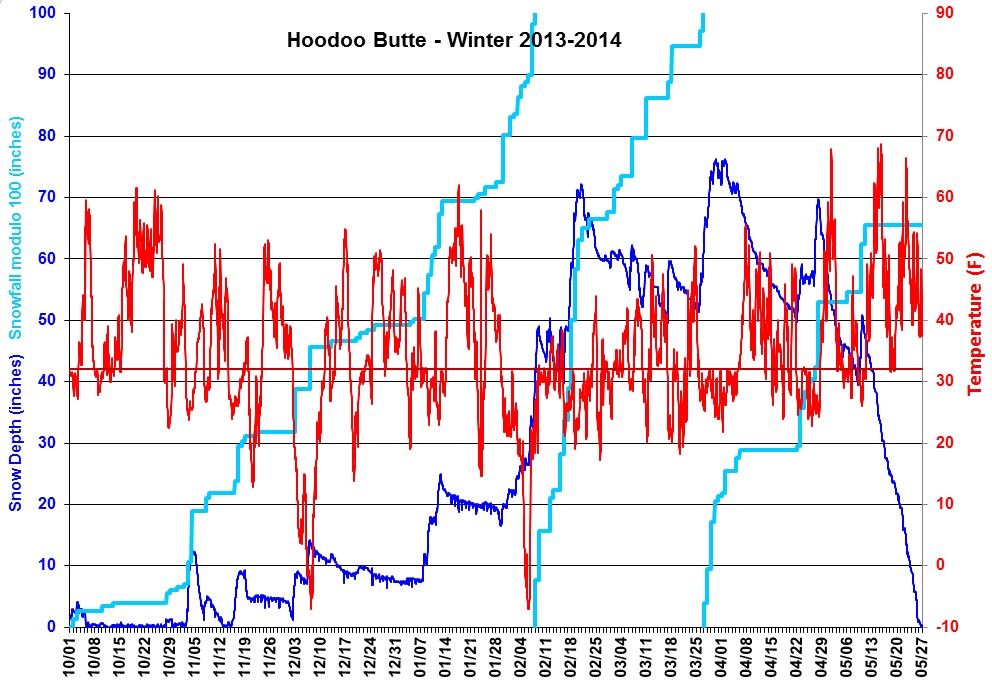
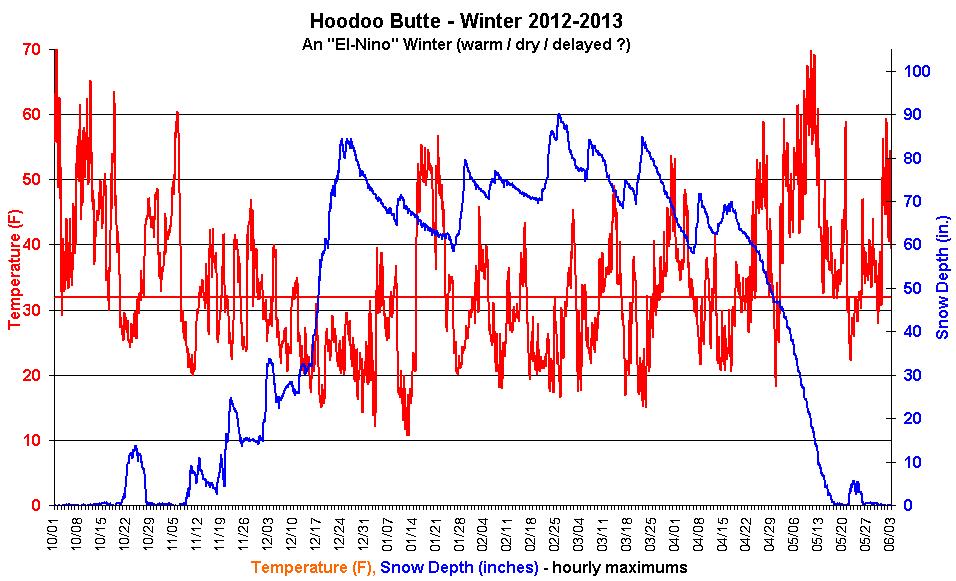
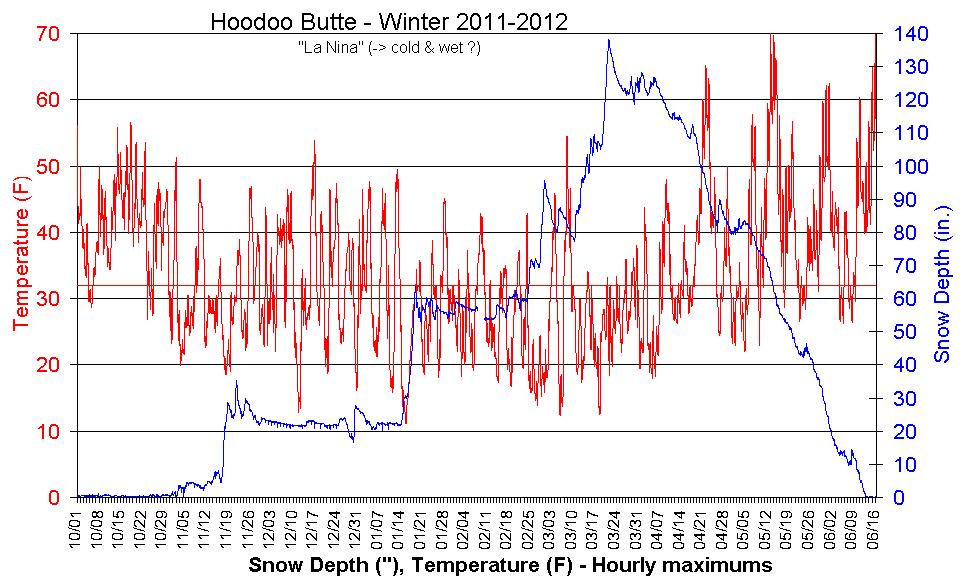
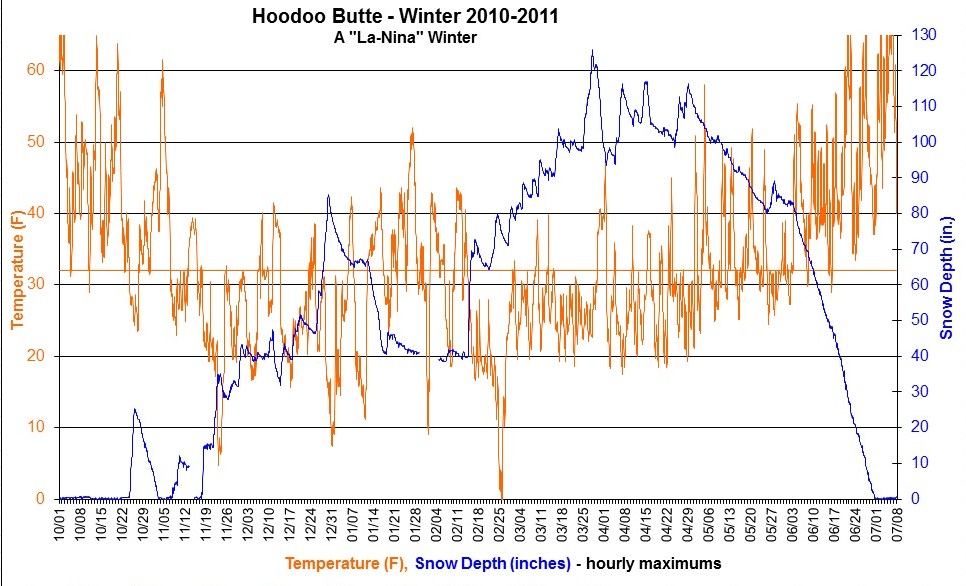
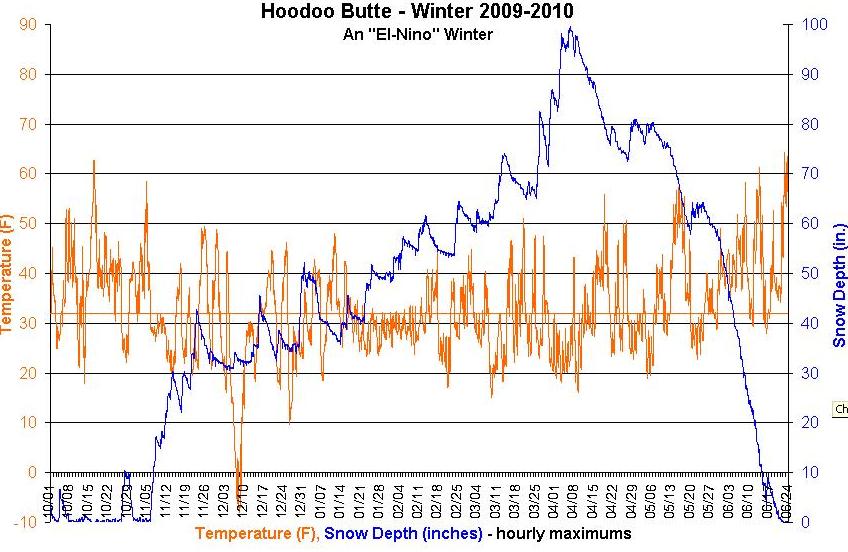
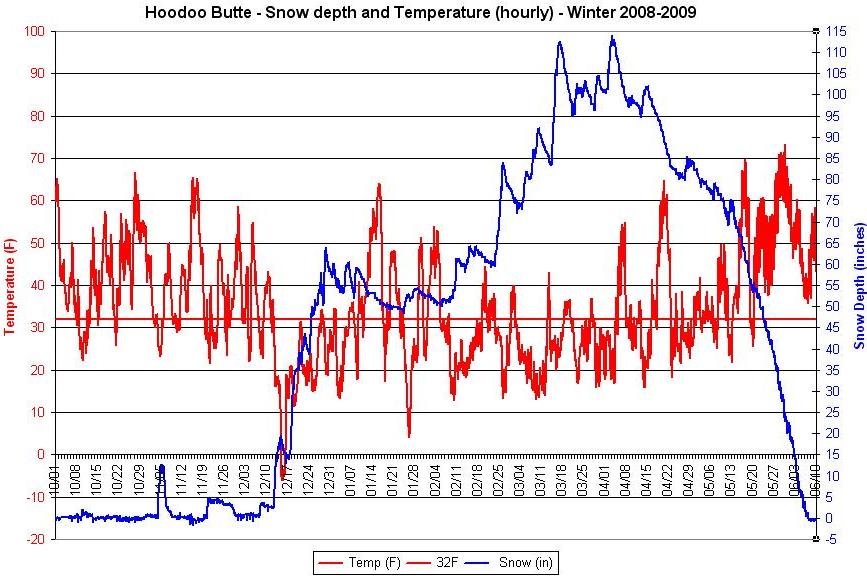
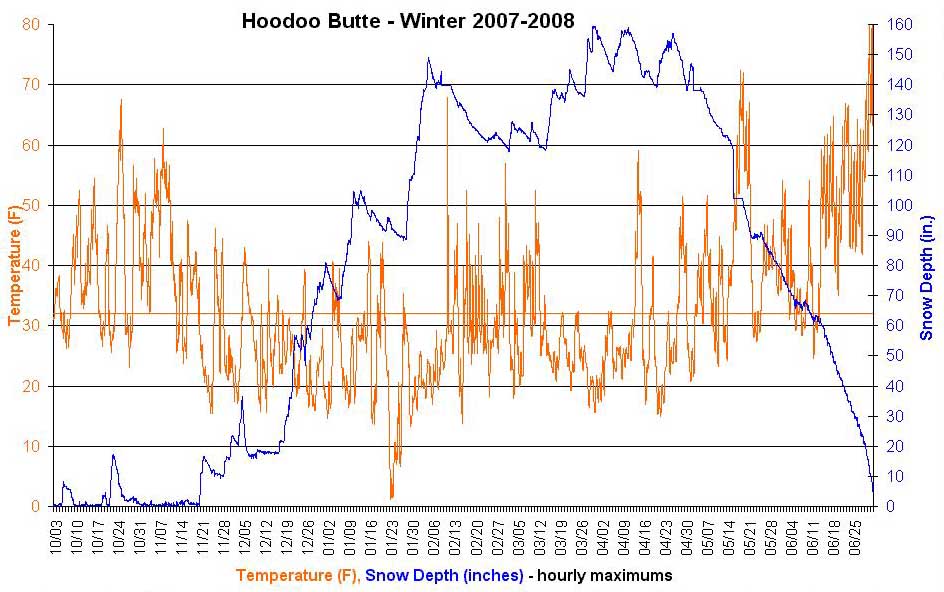
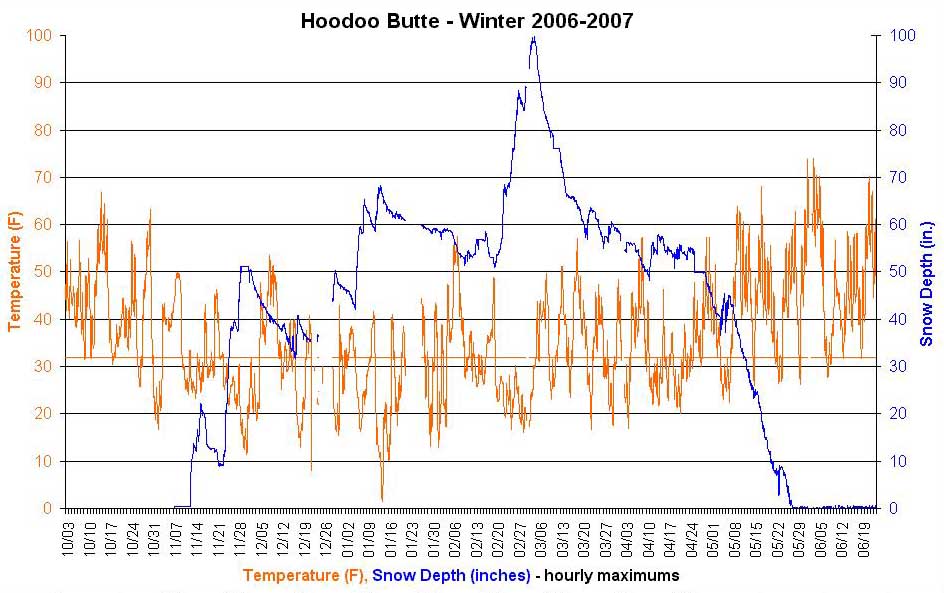
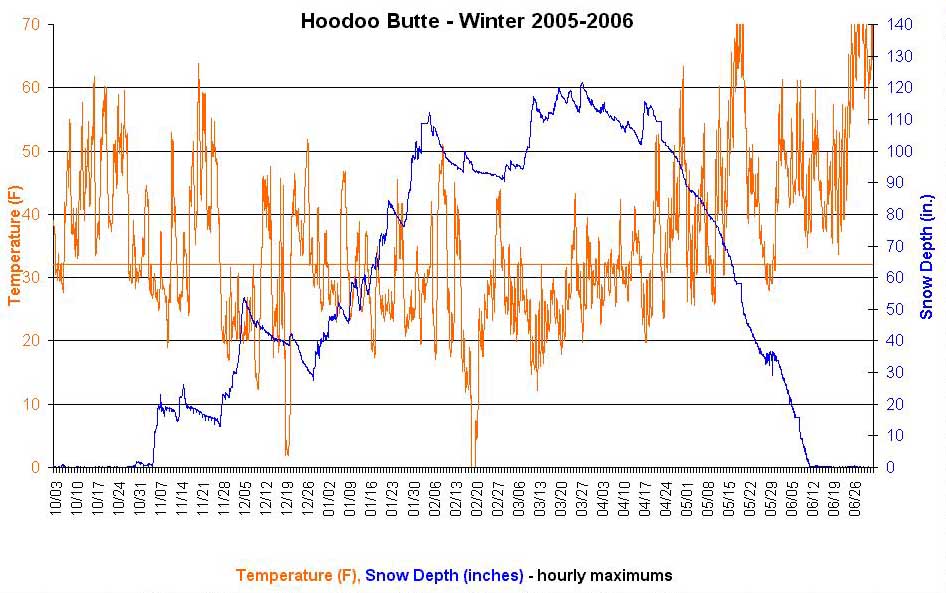
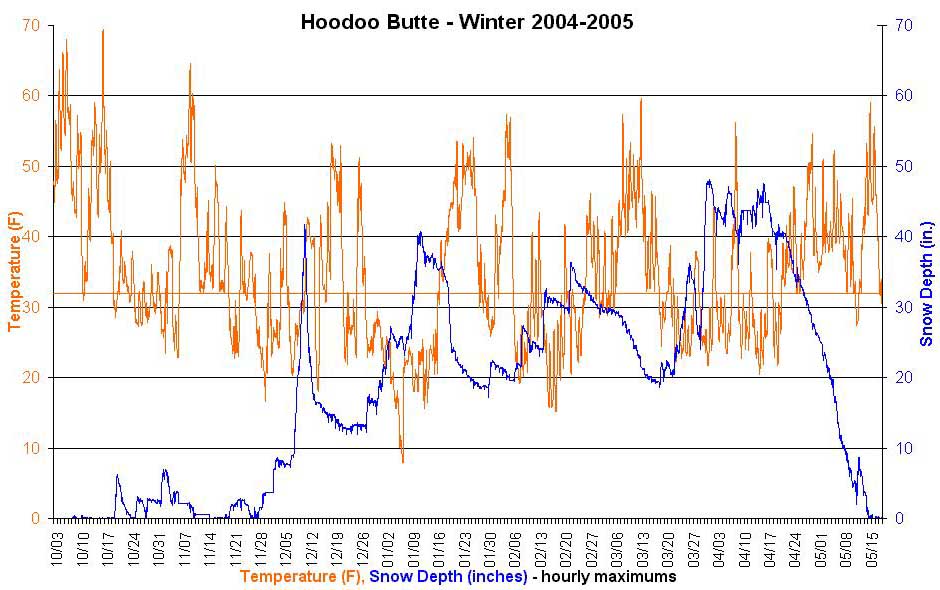
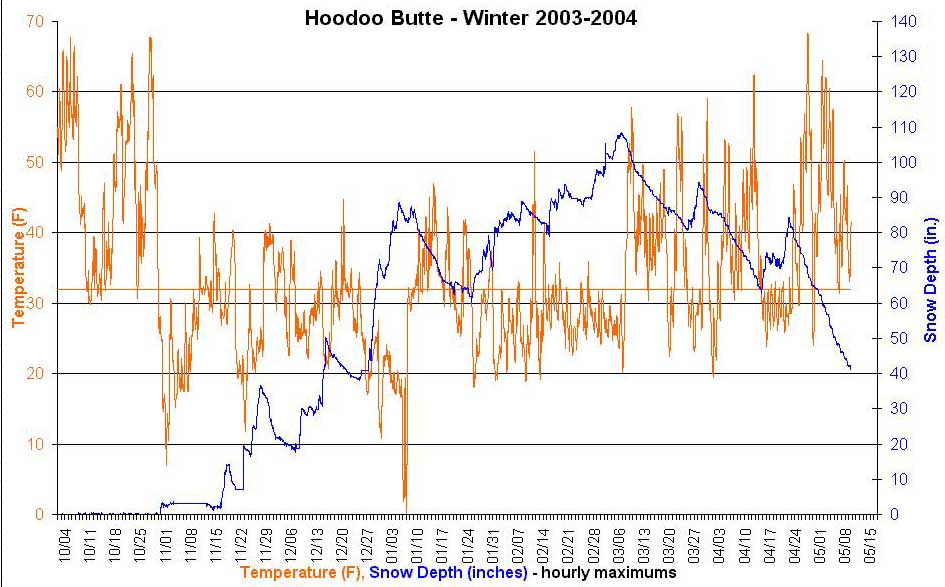
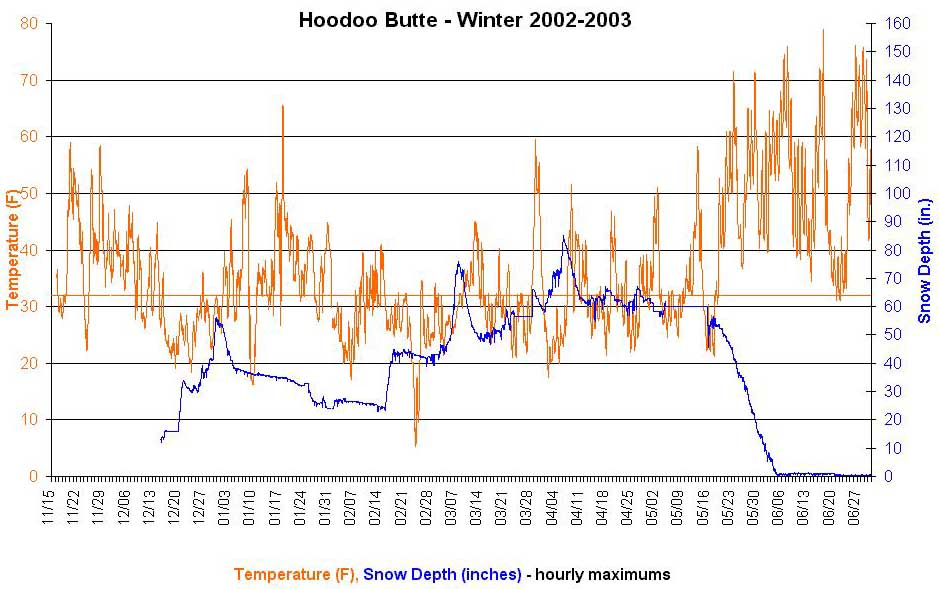
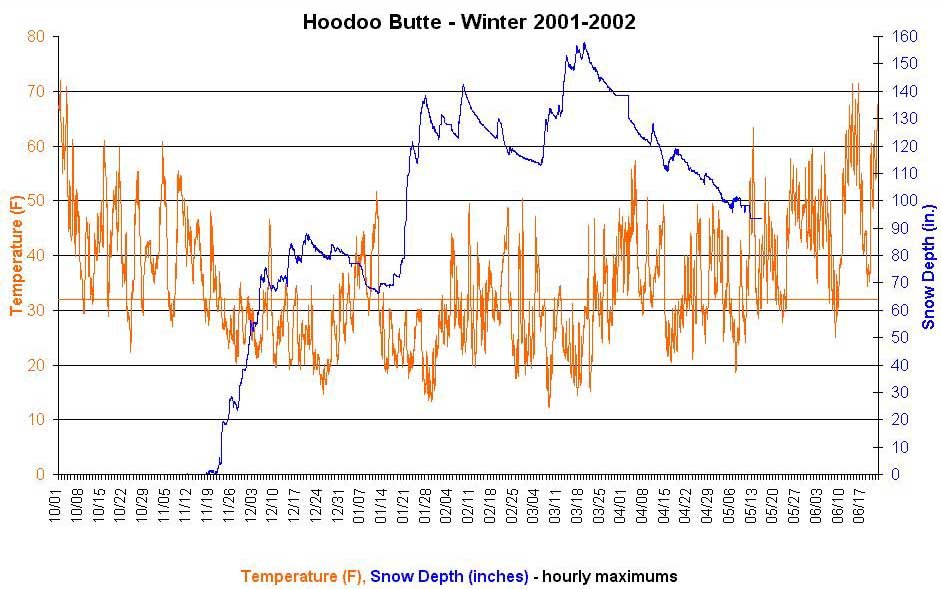
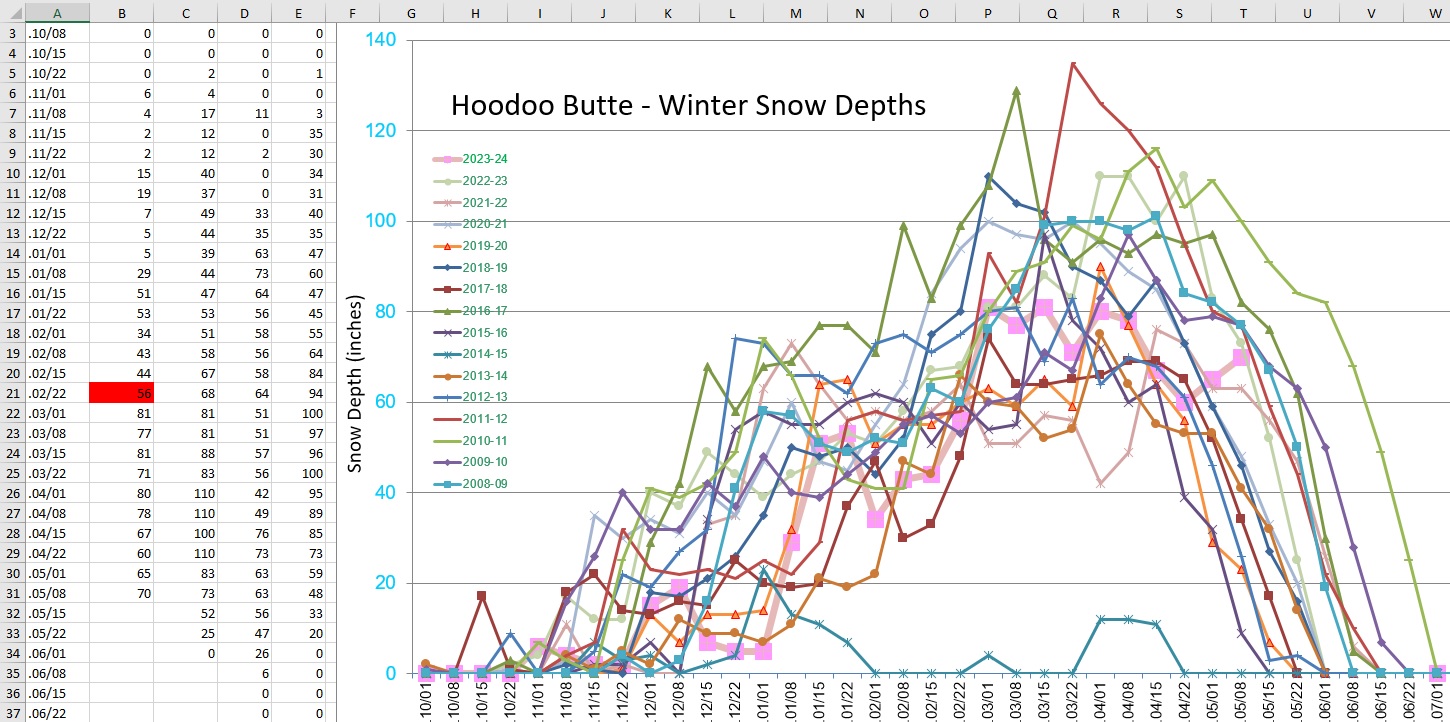
Graphs of temperature & snow depth: 2025-26 & 24-25, 23-24, 22-23, 21-22, 20-21, 19-20, 18-19, 17-18, 16-17, 15-16, 14-15, 13-14, 12-13, 11-12, 10-11, 09-10, 08-09, 07-08, 06-07, 05-06, 04-05, 03-04, 02-03, 01-02 Winter snow depth histories - ".CSV" file data which could look like this "On this date" - How today compares to this date in previous years About this page, this weather station, the pictures, and making your own weather station. Short weather page, winter's summary (.CSV), 7 days of raw data, last 6 hours Keeping it running: Manzanita battery performance, System Check |
| Like it? | This page is brought to you courtesy of the Santiam Pass Ski Patrol and their web site. If you like what you see, let them know. If you don't like what you see, use the "Email them" feedback link given below to suggest an improvement. If you don't like the weather, we may not either, but that's a whole 'nother discussion . . . |
| Ideas? | Most of the instruments and software used to generate these weather
condition pages were provided by the
Santiam Pass Ski Patrol.
The precipitation sensor data is provided by the Natural Resources Conservation Service (NRCS), which maintains many "SNOTEL" sites from New Mexico to Alaska.
If you have ideas for improvements to this weather page, please
Email them
to " |
| Notes: |
- Files are uploaded shortly after the hours of 8, 12, 16, 20. |
| To: | Hoodoo Ski Area's main page |
 ".
".